Decisions need context.
So do agents.
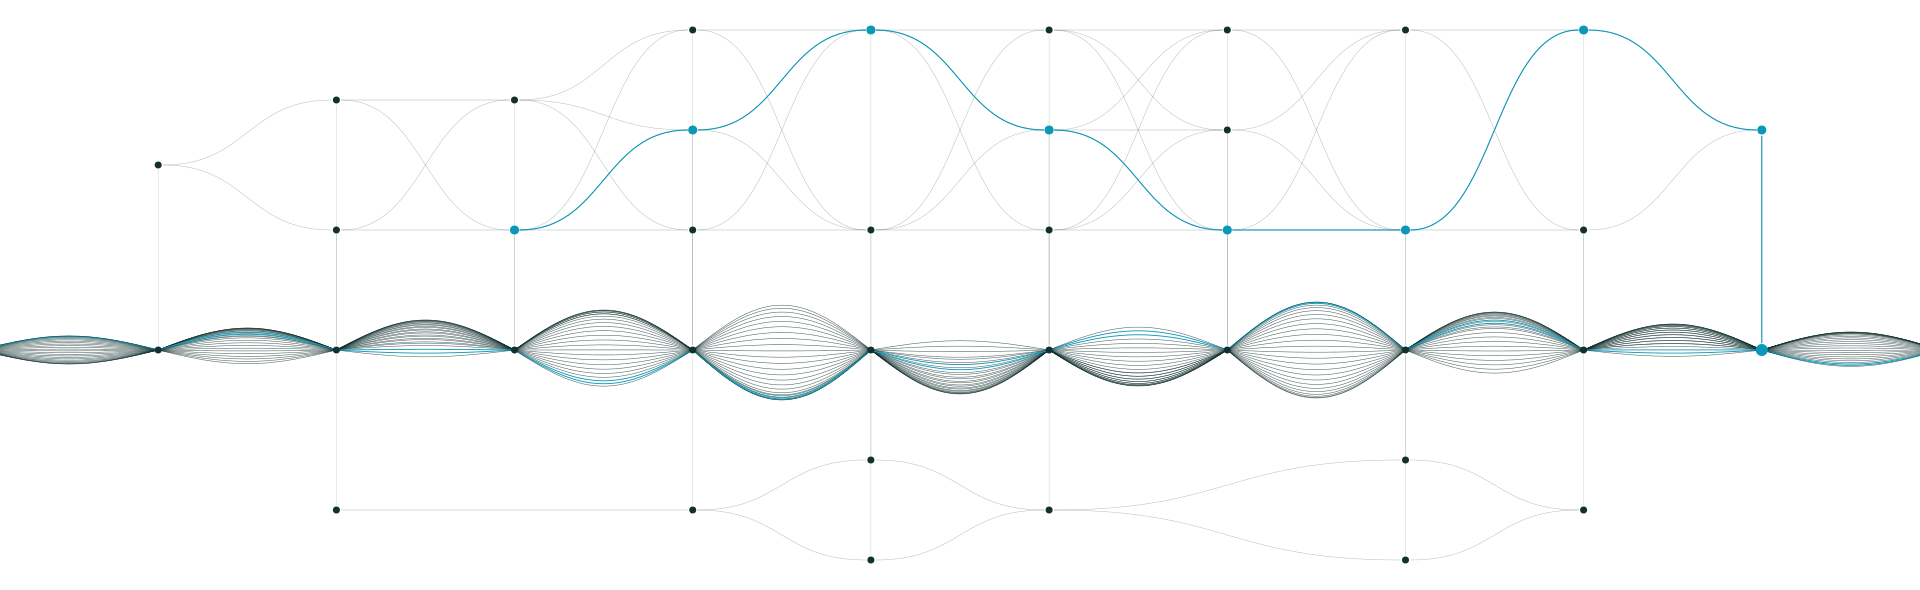
rygg makes your organization’s knowledge about its users explicit: one maintained graph for the whole organization, for product development and for AI agents.
- L1 · OntologyConcept: Safety requirement
- L2 · ContextREQ-114 Braking distance
- L3 · EvidenceFinding P-22 · tested
- AI · suggestionTC-31 Test case
Teams and agents have strength. rygg gives them support and direction.
Your organization knows a lot about its customers and users. That knowledge sits in people’s heads and in reports nobody opens again. Departments work with different pictures, product decisions rest on assumptions, and AI agents can read neither heads nor forgotten reports.
rygg is Swedish and Norwegian for backbone. It connects a managed ontology with your context of use and the evidence about it into a living knowledge graph, gathered in the field, validated against HCRD standards and continuously maintained.
One graph of what your organization knows
The graph is built in two steps. You license a managed ontology. Research, evaluation and evidence from your organization then become the context and evidence layers of the graph, and we keep them current.
- Step 1License the managed ontologyThe concepts and relations of the context of use and the method network, defined and maintained by us.
- Step 2Add research, evaluation and evidenceFrom your organization, step by step. The result is two maintained layers in your graph: context and evidence.
Managed and deterministic. Defines which concepts exist and how they relate, from context of use to metric. Comes with our method network.
Your context of use: user groups, tasks, conditions, needs and requirements, gathered in the field or taken from what you already know.
What was tested, decided and measured: findings, decisions, metrics. Each with a status that shows what is evidence and what is assumption.
Every metric traces back to an observation
Every requirement traces back to an observed need, every solution to a requirement, every evaluation to a decision and every metric to a finding. Every node is a Markdown file in the Open Knowledge Format (OKF) v0.2, readable by people and agents.
- 01Context of useWho works on what, under which conditions, and where does the work break down?
- Conditions
- User groups
- Tasks
- Current scenarios
- 02User requirementsWhat do the user groups need?
- Needs
- User requirements
- 03SolutionWhich elements meet the requirements, and which decisions shape them?
- Design solutions
- Design decisions
- 04EvaluationHow is it tested, and what was confirmed or contradicted?
- Evaluation measures
- Evaluation findings
- 05MetricsHow does the organization see effectiveness, efficiency and satisfaction?
- Metrics

One graph, three uses
A shared model of what the organization does, for whom and why, from apprentice to board.
Explore the 10 questions 02Human-centered Product DevelopmentActivities and decisions in product development focused on outcomes for users, and through them on economic results.
Explore the 7 questions 03AI-augmented EngineeringAgents in engineering, documentation and service that ask the graph instead of making assumptions.
Explore the 6 questionsEvery contribution shows where it comes from
People and agents work on the same graph. Every statement and every suggestion is backed by nodes from ontology, context and evidence. Approval stays with people. Teams decide on the same evidence, and agents ask instead of assuming.
- HumanCreated or owned by a person
- AI workingAn agent is reading or writing in the graph
- AI suggestionBacked by provenance, not yet approved
- VerifiedA human has confirmed it. The node becomes part of the graph.

Start with evidence. Grow into a graph your organization can use.
Research and design to HCRD standards. Results are documented so they can become part of a graph.
Project02PilotTry rygg on your own contextFour to eight weeks, one slice of your organization, one product line or one agent task as a graph.
4 to 8 weeks03GraphYour context of use, maintainedA maintained domain model of your context of use, validated against HCRD standards with every release.
Subscription, 12 months minimum04Context Layerrygg in operation, measured by resultsWe run the graph as a knowledge layer for your agents and embed Research & Design Engineers in your teams.
Framework agreement, 12 months minimum